2019-02-20
阅读量:
2313
多组数据的直方图与密度图的绘制方法
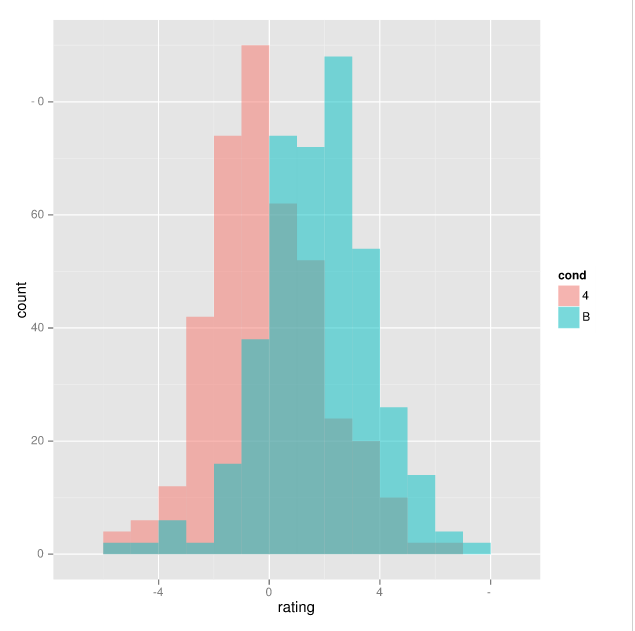
- # 叠加直方图
- ggplot(dat, aes(x=rating, fill=cond)) +
- geom_histogram(binwidth=.5, alpha=.5, position="identity")
-
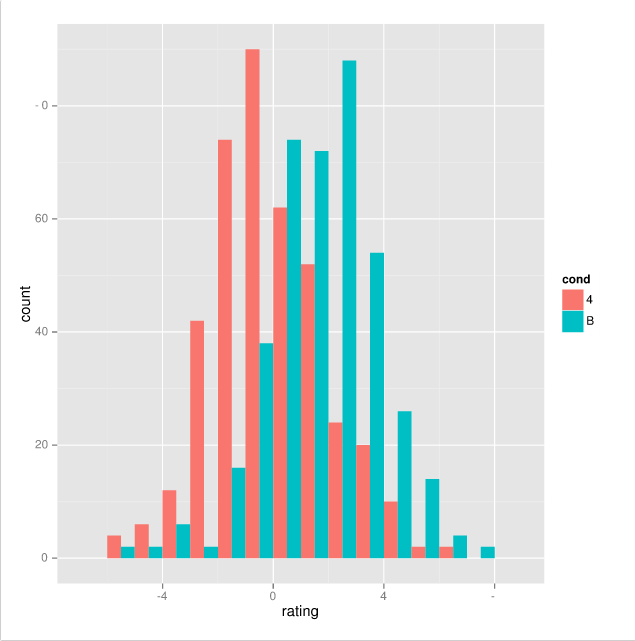
- # 交错直方图
- ggplot(dat, aes(x=rating, fill=cond)) +
- geom_histogram(binwidth=.5, position="dodge")
-
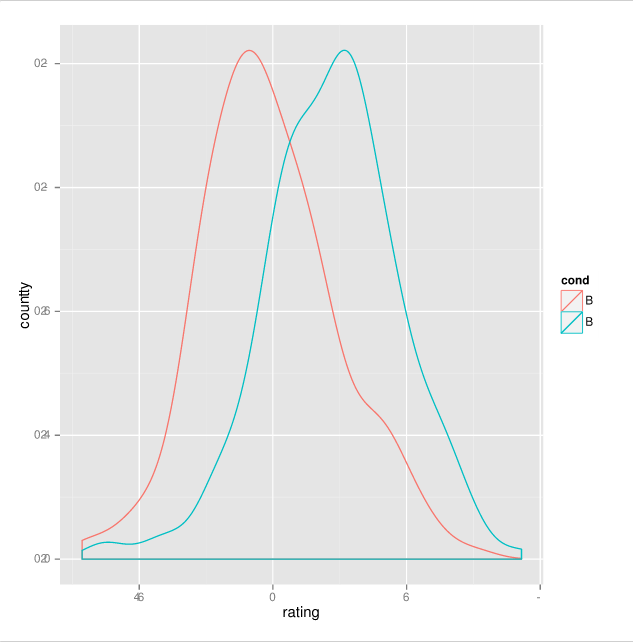
- # 密度图
- ggplot(dat, aes(x=rating, colour=cond)) + geom_density()
-
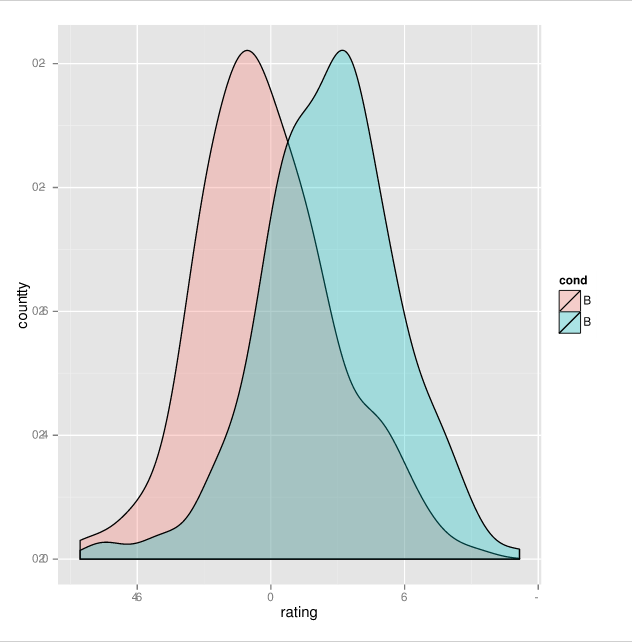
- # 带半透明填充的密度图
- ggplot(dat, aes(x=rating, fill=cond)) + geom_density(alpha=.3)


 0.0000
 0
0
 1
1

 关注作者
关注作者
 收藏
收藏
评论(0)
 发表评论
发表评论
暂无数据
推荐帖子
0条评论
0条评论
0条评论


